Challenge 2: Inflation Measures Analysis
Objectives
You have access to the
Statistics Sweden (SCB) data through the
scb-opendata-mcpserver. You can query economic data using the scb_* tools.Rikskbanken data through the
swemo-mcpfor CPI, CPIF, GDP, and other economic indicators.
The goal is to analyze and compare different inflation measures in Sweden.
Use case
Challenge
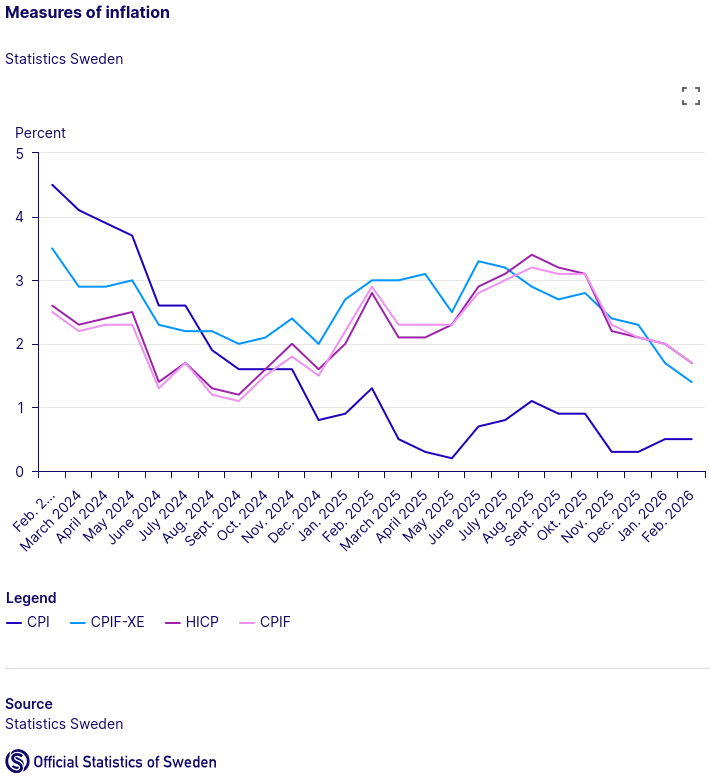
Retrieve and compare the following inflation measures for Sweden for the years 2020-2025:
CPI (Consumer Price Index)
CPIF (Consumer Price Index with fixed interest rate)
CPIF-XE (CPIF excluding energy products)
HICP (Harmonized Index of Consumer Prices)
Calculate the annual inflation rate for each measure and visualize the trends.
Important
Example workflow
Start by searching for tables showing the different inflation measures.
Retrieve the monthly or annual data for the specified measures. Aggregate them if needed.
Ground truth: SCB report: Different measures of inflation
Further improvements
Optional Challenges
Interactive Visualization: Create an interactive plot showing the trends of different inflation measures over time.
Tip
Instruct which library to use:
Generate a Python app which uses libraries like Plotly, Matplotlib, Gradio, Streamlit, Holoviz, Altair, Seaborn, or Bokeh
Use Javascript (either front-end only or full-stack) app which uses D3.js, Chart.js, Vega-Lite, Observable Plot, or Pico.css
For data handling, SCB returns JSON-stat responses which can be processed using:
Python: pyjstat
JavaScript: jsonstat-toolkit
Extended Analysis: Extend the analysis to include more years (e.g., 2010-2025) to identify longer-term trends.
Correlation Analysis: Analyze the correlation between different inflation measures and the GDP (Gross Domestic Product).
Tip
Instruct which library to use:
Generate a Python app which uses libraries like Pandas, NumPy, Scipy, Seaborn etc.