Challenge 1: Regional Emission Intensity Analysis
Objectives
You have access to the Statistics Sweden (SCB) data through the MCP server. You can query environmental and economic data using the scb_* tools. The goal is to analyze and compare emission intensity across Swedish regions.
Use case
Challenge
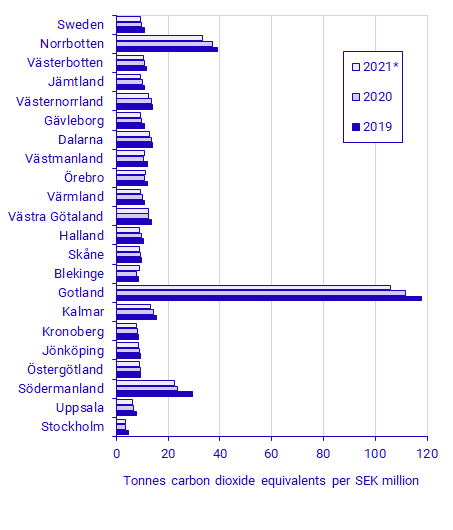
Calculate and compare the gross emission intensity (tonnes of CO2 equivalents per million SEK of economic output) for at least 3 Swedish regions (e.g., Stockholm, Gotland, Norrbotten) for the years 2019-2021.
Important
Example workflow
Start by searching for tables showing emission data and econonic profile by region.
Compute emission intensity using the formula:
Intensity = Emissions (tonnes) / GRDP (million SEK) * 1000for the years 2019-2021.
Ground truth: SCB report: Regional greenhouse gas emissions are increasing
The required tables can be easily retrieved using the search function in the MCP server. However just in case if you get stuck, here is a hint:
Hint
The following tables to use
Emissions data: Retrieve air emissions by region and substance (GHG in tonnes CO2 equivalents) from table TAB4357
Economic data: Retrieve Gross Regional Domestic Product (GRDP) by region from table TAB3138
Futher improvements
Optional Challenges
Interactive Visualization: Create an interactive plot showing emission intensity trends over time for multiple regions.
Tip
Extended Analysis: Extend the analysis to include more years (e.g., 2015-2023) or more regions to identify longer-term trends and regional patterns.
Map Visualization: Create a map visualization to show the distribution of emissions across different regions.
Tip
Instruct which library to use:
Generate a Python library like ipyleaflet or Folium
Generate Javascript app which uses leaflet.js
For data handling, SCB returns JSON-stat responses which can be processed using:
Python: pyjstat
JavaScript: jsonstat-toolkit